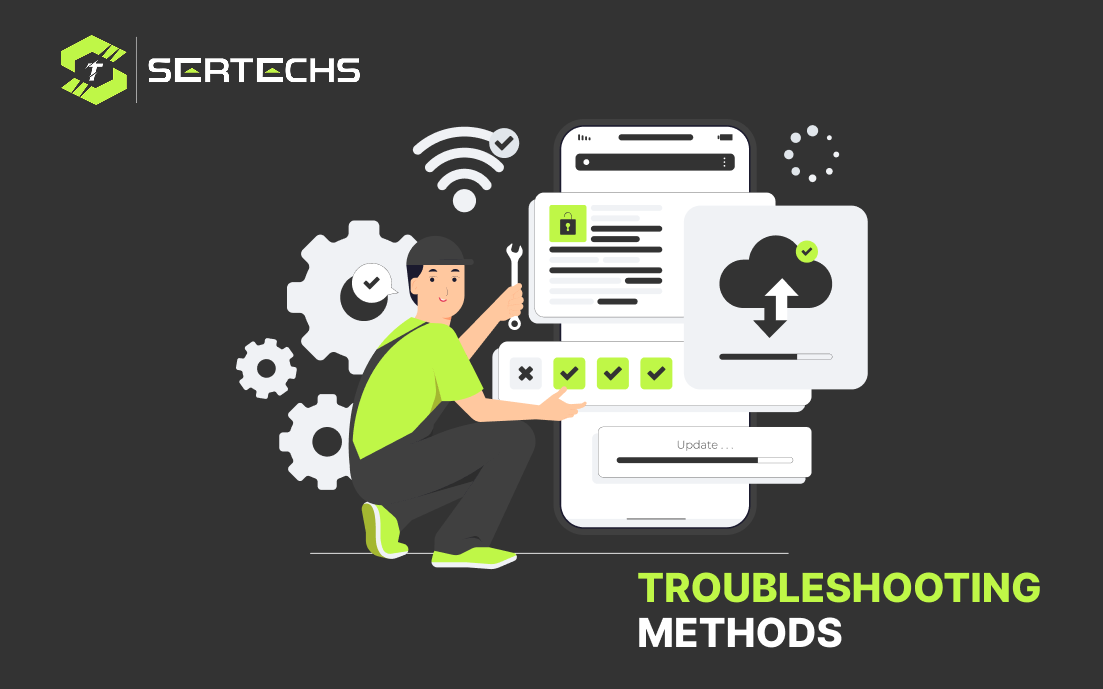
Troubleshooting in web development involves identifying, diagnosing, and resolving issues that may arise during the development or deployment of web applications. Here are some general troubleshooting methods in web development:
Check Browser Developer Tools:
Use browser developer tools (Chrome DevTools, Firefox Developer Tools, etc.) to inspect elements, view console logs, and monitor network requests.
Check for JavaScript errors and warnings in the console.
Examine Network Requests:
Inspect network requests to identify any failed requests or slow-loading resources.
Check HTTP status codes for responses to identify server-side issues.
Console Logging:
Insert console.log statements in your JavaScript code to trace the flow of execution and log variable values.
Utilize more advanced logging techniques, such as console.group() and console.table().
Check Server Logs:
Examine server logs for error messages and warnings.
Verify that server configurations are correct, and the server is running.
Browser Compatibility:
Ensure that your web application is compatible with different browsers. Cross-browser testing can help identify issues specific to certain browsers.
Clear Caches:
Clear browser caches to ensure that you are loading the latest versions of your files.
Disable caching temporarily during development.
Check for CORS Issues:
If your web application makes requests to a different domain, check for Cross-Origin Resource Sharing (CORS) issues.
Ensure that server responses include appropriate CORS headers.
Debugging Tools:
Use debugging tools and frameworks like React DevTools, Redux DevTools, or Vue Devtools if you are working with specific frameworks.
Remote Debugging:
Use remote debugging tools to inspect and debug applications running on remote devices or servers.
Remember that effective troubleshooting often involves a combination of these methods. Patience, persistence, and a systematic approach are key when tackling issues in web development.